
views
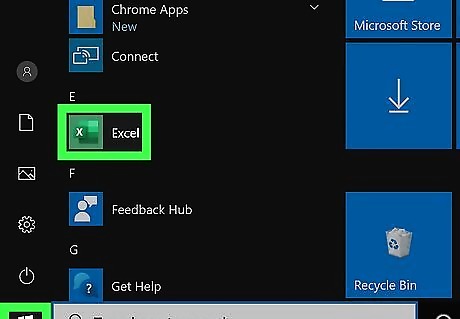
Open your project in Excel. If you're in Excel, you can go to File > Open or you can right-click the file in your file browser.
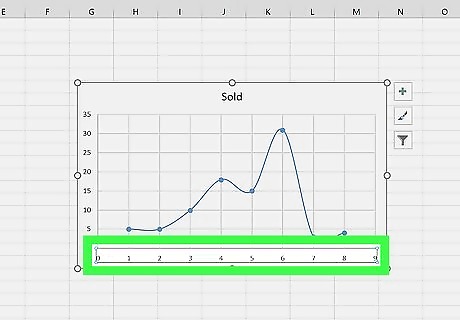
Right-click an axis. You can click either the X or Y axis since the menu you'll access will let you change both axes at once.
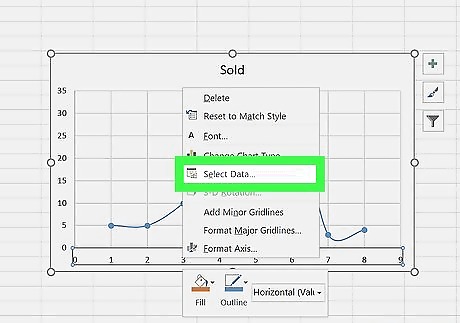
Click Select Data. This is usually in the third grouping of the menu that pops out at your cursor.
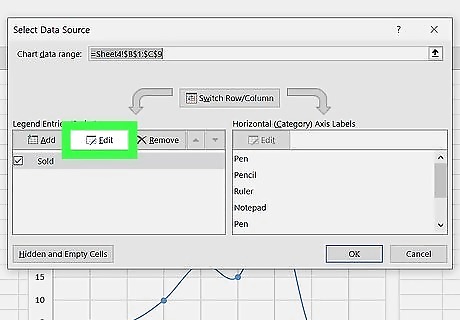
Click Edit. You'll see this on the left side of the window that pops up. An "Edit Series" window will pop up. What you need to do here is add the data here that is showing up on the other axis.
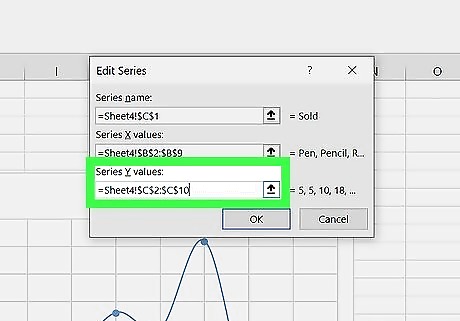
Type the data currently in "Series Y Values" in the text field under "Series X Values." You'll most likely want to copy the information from both axes into a notepad before you copy and paste over it.
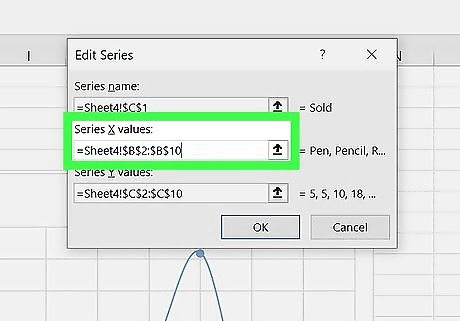
Type the data from "Series X Values" in the text field under "Series Y Values." Once you have the data switched, you'll be able to continue.
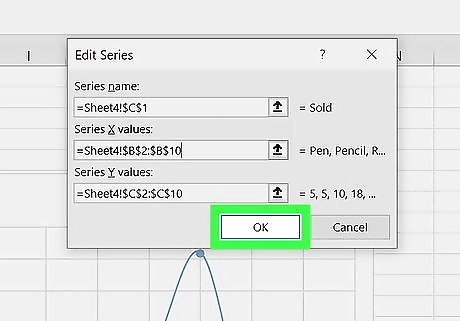
Click OK. You'll need to click Ok until all the windows are closed. You'll note that your chart has changed and displays the updated axis information.


Comments
0 comment