views
The tools discussed here are classified based on cost to users viewing the analytics (free versus freemium versus paid; the freemium tools have a publicly accessible free version but more data available in a paid version), method of estimation (direct measurement (using server logs or a tracking beacon) versus estimation by extrapolating from a panel of users who are being tracked) and website coverage (some websites only, versus most or all websites).
If you want analytics for your own websites, then you should install analytics tools such as Google Analytics, Adobe Analytics, Quantcast Measure, Chartbeat, or others directly on your site, rather than use the methods below. The methods below can give you some insight into how others might be trying to estimate your traffic data.
Using Quantcast Measure
Get data about the website, if available, at https://www.quantcast.com/
Use the following rules of thumb when judging whether the website you are looking for (or similar websites) would have Quantcast data available. Most of the websites that share data with Quantcast and allow Quantcast to show the data publicly tend to be media websites whose business model is advertising-based. Moreover, most of them are either based in on have a significant presence in the United States, since Quantcast data is most reliable and most useful to show to advertisers for United States audiences. In particular, if the topic of your website is not one that media companies and publishing groups have interest in, it can be hard to find examples to benchmark against. Another thing to keep in mind regarding the availability of Quantcast data is that the decision to share data with Quantcast is made at the level of the media company or publishing group, rather than the individual website. Therefore, either all (or most) of the websites under a given publishing group would have QM data publicly visible, or none would. Some publishing groups and companies that have publicly available QM data for most of their sites include: the Stack Exchange Network (Stack Overflow and all Stack Exchange sites), Tegna, Woven Digital (Uproxx, Brobible, and some other male-focused humor and celebrity news sites), Vox Media Network (Vox, Eater, Racked, and a few other sites), Onion Media Network (The Onion and sister sites), COED Media Group Network (COED, College Candy, and Busted Coverage), Bonnier Corporation Network (many outdoors sporting sites as well as popsci.com), and Idle Media (HipHopEarly and sister sites). Some publishers that do not use Quantcast Measure or do not share the data publicly include Hearst, Conde Nast, and Time Inc. Image-sharing sites (such as Imgur, Giphy, Gfycat) all have publicly available Quantcast Measure data. However, it doesn't hurt to check even if you don't expect the website to share data using Quantcast Measure. For instance, Trello and Glassdoor both use Quantcast Measure though they don't fit the "publisher" stereotype perfectly.
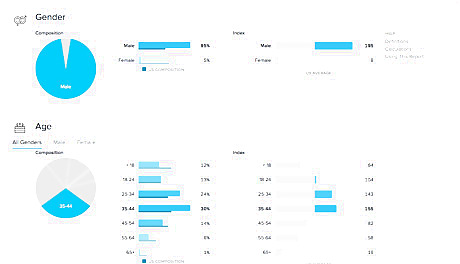
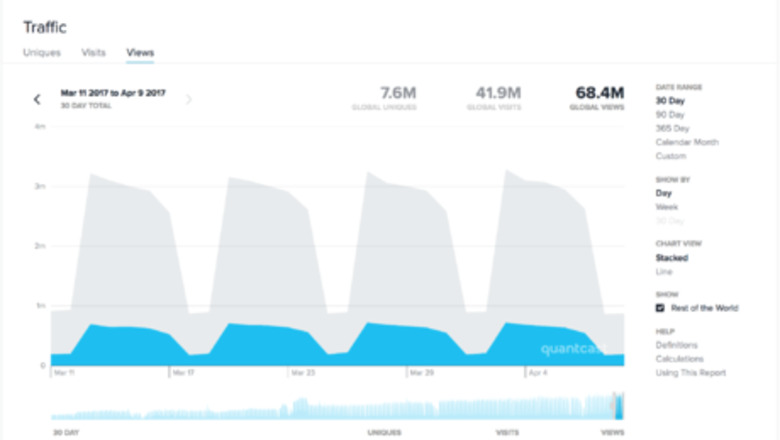
Examine the various parts of the traffic report. The first section of the traffic report is the Traffic Card, showing total uniques, views, and visits over a time range of your choosing, and at a granularity of day, week, or 30 day. Uniques are available only over time periods of a day, week, or 30 days. Data is available only from the point in time the website started using Quantcast Measure. Data is broken down as United States and non-United States. The timezone is chosen based on the place where the majority of traffic to the website comes from; for most websites that use Quantcast Measure, this is the United States, and the timezone is Mexico City's timezone (as that it close to the average of the various US timezones). The traffic numbers are based on direct, first-party measurement (using Quantcast's JavaScript installed on the website, that works in a similar way as Google Analytics). It therefore measures all traffic by users on browsers that can run JavaScript and are not using an ad blocker setting that blocks analytics tools. The numbers shown here can be compared with the numbers shown in Google Analytics, though they may not exactly match. The second section of the traffic report is the Demographics Card. This includes gender, age buckets, education level, and race. Unlike the traffic card, the demographics card is not based purely on direct measurement: it is based on a mix of measurement and extrapolation, where the demographic characteristics of each visitor are estimated based on a variety of visitor-specific signals. Quantcast uses seed data from a panel of users who have disclosed all the relevant demographic data about themselves. Some of the data is only available for the United States subset of the audience. You can click on "View Details" at the bottom left for more information. The gender and age data here can be compared with the gender and age data shown in Google Analytics, at Audience > Demographics > Gender and Audience > Demographics > Age respectively. The other characteristics are not reported in Google Analytics.Quantcast ServerFault composition and index image.png Also of interest is the Geographic Card (reports top countries and cities sending traffic). This can be expanded to show more information using the "View Details" at the bottom left. Of these, the Geographic Card can be compared against corresponding data in Google Analytics under Audience > Geo > Location. The Engagement Card can be compared against the data in Google Analytics under Audience > Cohort Analysis. However, the displays do not precisely match.Quantcast ServerFault top cities.png Other relevant sections include: Cross-Platform Card (compares user behavior across platforms) and Engagement Card (segments users based on number of visits and reports counts in each segment; note that this is visible only to logged in users but does not require payment).Quantcast Serverfault Engagement.png The General Interests Card near the bottom contains a list of similar websites visited by users who visit the website. These can be useful to obtain benchmarks to compare site traffic against. The links point to the Quantcast pages for the websites; however, not every website listed uses Quantcast Measure.Quantcast Serverfault General Interests.png
Record any data you want to reference in the future. Websites may take themselves off of Quantcast Measure, or may stop making their data publicly visible. So you should save or screenshot the page, or record any data you need to, while you can access the data. You can request archival of the existing report using archive.is. Note that the archived page will not have the full functionality of the original page because of limitations in the way archival interacts with JavaScript.
Consider contacting the website owner to request making the data publicly available. If the website owner is not using Quantcast Measure, consider contacting the website owner proposing it. If the website owner is using Quantcast Measure, and has not made the data available, consider contacting the website owner regarding making the data publicly available. However, since Quantcast Measure makes data publicly visible by default, website owners who choose to hide the data are usually convinced of the superiority of doing so, and you may not be persuasive.
Using SimilarWeb
Get data about the website, if available, at https://www.similarweb.com/website/
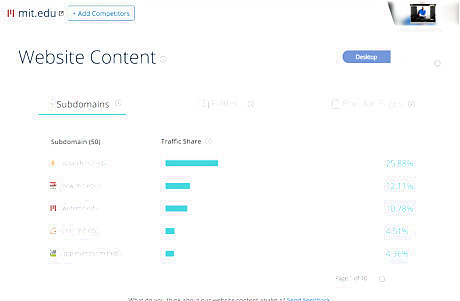
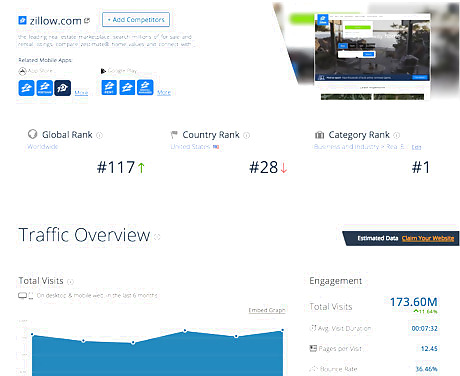
Examine the various parts of the traffic report. At the top you can see the rank of the website globally, in its country, and in its category. You can click through to get the list of top websites globally, by country, or by category. The basic SimilarWeb only gives a list of the top 50 websites; with SimilarWeb PRO you can get a longer list. Note that these ranks depend on estimated traffic computation for all websites in the category; since each of the traffic estimates could be inaccurate, the rank could also be inaccurate. The next section, Traffic Overview, includes a plot of total visits over the last six months, by month. To the right of the plot is information on total visits, average visit duration, pages per visit, and bounce rate over the last month. With SimilarWeb PRO, you will be able to get data over the last three years rather than the last six months. For most websites, the data is estimated rather than directly measured; for websites that have connected Google Analytics, the data is measured and says "Measured with Google Analytics" on the top right of the Traffic Overview section. Additional subsections under Traffic Overview include Traffic by countries and Traffic sources. Later sections are Referral, Search, Social, and Display Advertising. The Website Content section provides information on Subdomains, Folders, and Popular Pages. The basic SimilarWeb only shows the top five subdomains. With SimilarWeb PRO, you can see more subdomains, as well as get access to Folders and Popular Pages.SimilarWeb MIT subdomains.png The Audience Interests and Similar Sites sections provide more information on related topics and websites.
Record any data you want to reference in the future. SimilarWeb only shows a six-month history for visits and one month of estimated data for other metrics. Therefore, you should record, by saving or screenshotting, any data you want to reference in the future. You can request archival of the existing profile using archive.is. Note that the archived page will not have the full functionality of the original page because of limitations in the way archival interacts with JavaScript.
Keep in mind the following regarding error ranges, in cases where the data is estimated and not measured with Google Analytics. The estimated values for visits reported by SimilarWeb vary between half of and four times the values directly measured by sources such as Quantcast Measure or Google Analytics. The discrepancy for pageviews can be larger, usually arising from significant differences in pages per visit estimates. In July 2017, SimilarWeb estimated about 499,000 visits and 2.06 pages per visit to LessWrong, whereas Google Analytics data for the site (also available via SimilarWeb) showed 146,000 visits and 1.88 pages per visit. In July 2017, SimilarWeb estimated 4.62 million visits and 9.18 pages per visit to its own site, whereas Google Analytics data for the site (also available via SimilarWeb) showed 2.82 million visits and 2.78 pages per visit. The overestimation of visits is about 50%, whereas the pageview estimate is over five times the Google Analytics value. Glassdoor reported about 40 million visits and 140 million pageviews on Quantcast Measure in March 2017, compared with 54.5 million visits and about 200 million pageviews on SimilarWeb in the same time period. Trello reported about 46 million visits and 75 million pageviews on Quantcast Measure in March 2017, compared with about 85 million visits and 600 million pageviews on SimilarWeb. Stack Overflow reported about 265 million visits and 660 million pageviews on Quantcast Measure in March 2017, compared with 337 million visits and 1 billion pageviews on SimilarWeb. Upworthy reported 9.6 million visits and 11.3 million pageviews on Quantcast Measure in March 2017, compared with 7.5 million visits and 9.5 million pageviews on SimilarWeb. Accuracy in estimation of visits and pageviews is higher for websites with more traffic, and more unique visitors. Ranks and category ranks should be treated as loose estimates. Although the monthly traffic levels are not very accurate, the trends between months are somewhat more accurate. In other words, you can use the six-month graph of visits to get some sense of how traffic is varying with time. However, before drawing any conclusions, see if the trend is consistent with what you would expect given the annual traffic cycle for that type of website. Unfortunately, a six-month history does not provide a clear view into the full annual cycle. If you have SimilarWeb PRO, you will be able to get a better sense of whether an annual cycle is being captured and how that compares with expectations.
Consider contacting the website owner to connect the SimilarWeb data with Google Analytics. This will help the website owner be able to share up-to-date traffic data at any time, without having to manually export data from Google Analytics.
If you use SimilarWeb frequently, consider installing the SimilarWeb browser extension (or add-on). The browser extension is available for Google Chrome, Mozilla Firefox (where it's called an "add-on"), and Safari. With this extension, you will be able to, whenever you visit a website, view the SimilarWeb metrics from within your browser itself, without having to separately visit the SimilarWeb profile of the website. The extension does not give you access to any other information beyond what you can get from the profile -- it just makes the lookup process quicker. In return, installing the extension means that you get included in the panel of users whose behavior is collected by SimilarWeb to estimate website traffic.
Using Alexa Internet
Get data about the website, if available, at https://www.alexa.com/siteinfo/
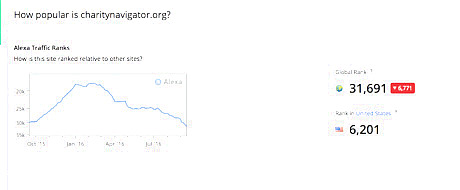
Examine the various parts of the page. The top of the page includes a "Global rank" and Rank in the country where the rank is highest. For websites in the top 100,000, historical data on global rank over the past year is also displayed. For others, there is space for the graph but it is not populated. Other sections that show some information are: Audience Geography, engagement data, search traffic and keywords, upstream sites, linking sites, related sites, subdomains, load speed, site description, and audience demographics. The free version only shows the top five results for some of these categories; paying users can access longer lists. Monthly Unique Visitor Metrics and sites people go to next are available to paying users. Notably, there is no direct data on the number of visitors and pageviews available to non-paying users, even though the ranking is based on those metrics.
Record any data you want to reference in the future. Alexa Internet shows a one-year history of the site rank, and moreover, does not show even this data for sites not in the top 100,000. You can request archival of the existing profile using archive.is. Note that the archived page will not have the full functionality of the original page because of limitations in the way archival interacts with JavaScript.
Keep in mind the following regarding error ranges. As mentioned above, Alexa generally uses data estimated from users of the Alexa toolbar, rather than first-party (i.e. individual websites') traffic numbers. This means that there is selection bias in the Alexa data: users of the Alexa toolbar do not represent a random sample of internet users. Peter Norvig gives some anecdotal evidence of this problem in his article "Alexa Toolbar and the Problem of Experiment Design". Alexa's traffic estimates can be off from first-party measurements by a factor of three in either direction. Since Alexa does not publicly release its traffic estimates, but only releases a rank, the rank should be treated as only a loose estimate. Be particularly suspicious of Alexa giving a very good rank in a smaller country that has no direct connection with the subject matter at hand. This is usually due to Alexa's sample accidentally oversampling users in the country using the website. Given the inaccuracy of the rank estimates, the trend in rank as seen in the chart is also not necessarily accurate, although large fluctuations in rank usually contain some kernel of truth. As a general rule, you should believe such a trend only if it is consistent with other sources of evidence, or common sense about the annual traffic cycle. Some examples of correctly picked trends are annual cycles for charity evaluators such as GiveWell and the Effective Altruism Forum. The increase in traffic and improvement in rank is consistent with first-party data published for the sites, as well as with the general intuition that charity-related activity peaks around December/January (Giving Season).
If you use Alexa frequently, consider installing the Alexa browser extension (or add-on). The browser extension, also known as the Toolbar, is available for Chrome With this extension, you will be able to, whenever you visit a website, view the SimilarWeb metrics from within your browser itself, without having to separately visit the Alexa Internet profile of the website. The extension does not give you access to any other information beyond what you can get from the profile -- it just makes the lookup process quicker. In return, installing the extension means that you get included in the panel of users whose behavior is collected by Alexa Internet to estimate website traffic.
Using HypeStat
Get data about the website, if available, at
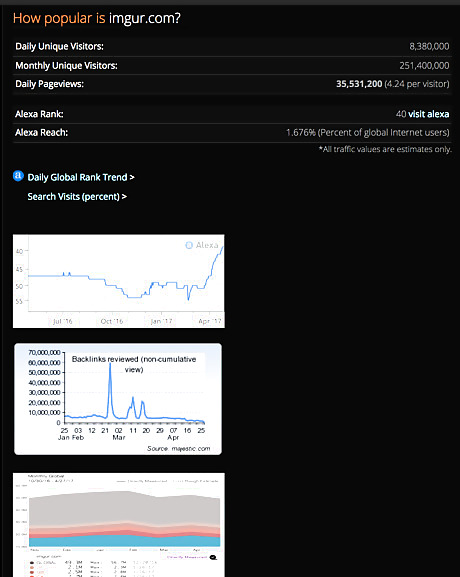
Examine the various parts of the page. Most of the page is obtained by cobbling together data available from different sources, including Alexa, Quantcast, SEO Majestic, SemRush, Moz, Google PageSpeed Insights, Google Safe Browsing, MyWot.com reputation ratings, and WhoIs lookups. The data includes an estimate for total traffic (daily and monthly unique visitors and pageviews). No source is provided for this data.
Using Website Traffic Statistics Pages and Similar Options
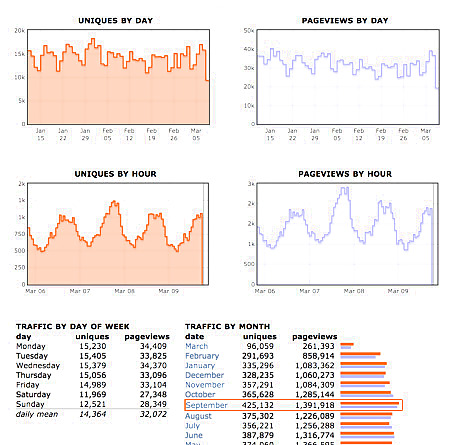
For user-generated content/self-published content websites, look for statistics pages that include traffic and social data for items.
User-generated content sites often include lists of top items and the traffic they receive. In some cases, they also include overall summaries, or summaries by category. Look for these.
Starting July 16, 2013, subreddits within Reddit could make their desktop traffic statistics available online at https://www.reddit.com/subreddits/
Look for monthly, quarterly, and annual review posts. For public companies, look for information in quarterly filings. For instance, Facebook's quarterly report includes a number of details about its userbase size, including Monthly Active Users (MAUs), Daily Active Users (DAUs), mobile MAUs, and mobile DAUs. Websites sometimes publish year-in-review, quarter-in-review, or other similar blog posts periodically with traffic metrics. Examples include charity evaluator GiveWell, pornographic video site Pornhub, and sharing/discussion site Reddit. In addition to looking for such reports on the website itself, look for them on the website of the publishing company that owns the website, if it is different (this distinction is particularly important for websites owned by a publishing conglomerate that owns many such websites).
Look for information on pages created by the website for potential advertisers.
The page typically has a URL of the form
Contact the website directly asking for data. Some websites offer an email address for potential advertisers to get in touch with them. If you are an advertiser or can represent yourself as asking on behalf of an advertiser, you may be able to use email to get the website owners to share traffic data, or address questions about the nature of their audience. Otherwise, try contacting the website owner or administrator asking for data, such as a Google Analytics data dump. There are two kinds of concerns you may ned to overcome: (a) unwillingness to share, and (b) effort of exporting data. You can reduce (b) by providing clear steps for how to export data, or even suggesting that they add your email account with "View & Analyze" permissions to their Google Analytics or equivalent solution. How you can overcome (a) is something you will need to figure out on a case-by-case basis.
Use ad networks or ad planners that the website has hooked to. Google Display Planner can be used to get traffic estimates for some websites. We can use other ad networks sometimes.
Using Other Web Sources
Check the Wikipedia page about the website or associated organizations. The Wikipedia page may have an infobox that contains entries with information about the traffic. This could include the Alexa rank. The text of the Wikipedia page may have information about traffic. The information may be in the introduction, a section on traffic, or a history or growth section. Check the sources cited to determine the reliability and methodology.
Use web search (such as Google Search) and within-site search.
You can search within the website by using the site: operator in Google Search, or use the site's own internal search engine.
You can search in publications that cover news in the domain of the website (using web search with the site: operator, or within-site search). For instance, for publisher websites, search in sources such as digiday.com, adexchanger.com, adweek.com, and adage.com. For technology companies, search in sources such as techcrunch.com and mashable.com.
You can search the whole Internet with a search term such as "
Using Surveys
Look for existing surveys that give an estimate of use. Survey data can generally help give an estimate of the number of users, and the average frequency of visits. They are too crude a tool to estimate the number of pageviews. Surveys have both upsides and downsides. They rely on memory, and therefore tend to give more weight to visits to websites that the user remembers. This can be a positive, if we are trying to measure the extent of genuine, intentional and/or impactful visits, but it can also lead to underestimation of sites that have a less distinctive brand (for instance, websites that people visit from search results to quickly answer a question, but do not register mentally as a source). You can get surveys related to Internet use at the Pew Internet website of the Pew Research Center. Another potential source is Public Knowledge (at publicknowledge.org). Another information source is the Wikimedia Foundation's Global Reach survey, with results so far for India, Nigeria, and Brazil.
Consider conducting your own survey. This is helpful if there are no existing surveys asking for information on usage of the site. You can design an online survey using tools such as SurveyMonkey, Google Forms, or Qualtrics. You can use tools like SurveyMonkey Audience, Google Surveys, or Survata to distribute your survey to a general Internet audience in the United States and a few other countries (Australia, Canada, and the United Kingdom). This approach works best for sites that cater to a general audience and have huge enough overall traffic. As a heuristic, for a website that gets over 10 million visits a month from the United States, you should be able to get a positive number of responses to the question "Have you visited this website?" if distributing to 100 people. Alternatively, you can distribute the survey to a more targeted audience by sharing it in a Facebook group or a subreddit that reaches that audience. This is most useful for websites that cater to that audience, so that you can extrapolate from the surveyed sample to the total population to get a decent estimate of website traffic.


Comments
0 comment