views
- Highlight the data you want in the graph by clicking the top-left cell and dragging to the bottom-right cell.
- Click "Insert" → "Line Graph" icon (two intersecting line graphs) → click a graph style.
- Click the graph to customize it. Change the style, position, size, and name of the graph.
Creating a Graph
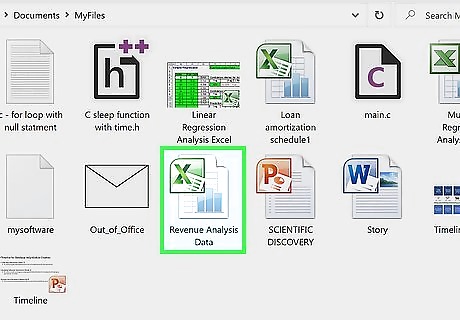
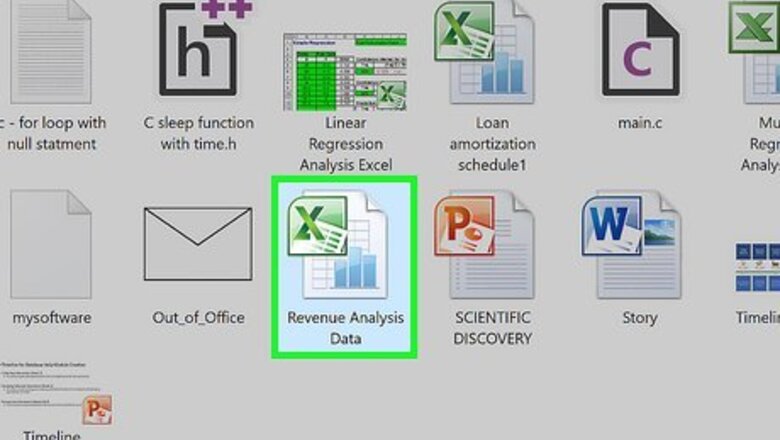
Open a workbook in Microsoft Excel. You can use an existing project or create a new spreadsheet. Microsoft Excel is available on Windows and Mac. You can also use the online web version at https://www.office.com/. You can use Excel to make tables, type formulas, and more.
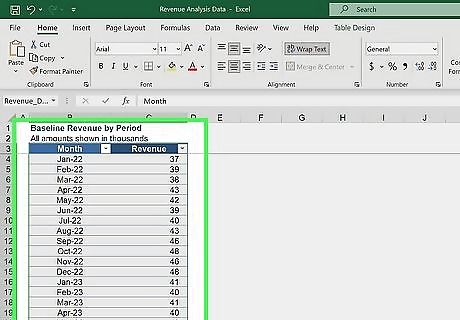
Highlight your data. Click and drag over the cells containing the data you want to use in your line graph. If your data isn't already entered, do so now. Be sure to select column headers if you have them. To select everything, click the top-left cell of the data. Press CTRL + A (Windows) or Command + A (Mac).
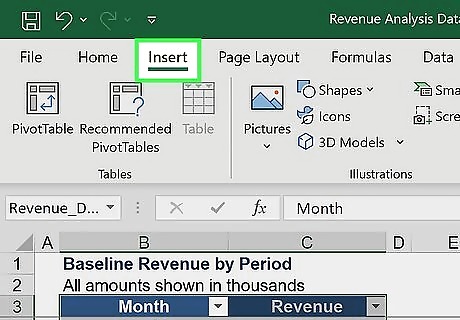
Click the Insert tab. This is at the top toolbar.
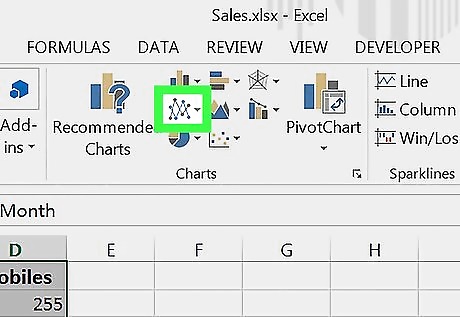
Click the graph icon. This looks like two intersecting line graphs. You can find this in the Charts section.
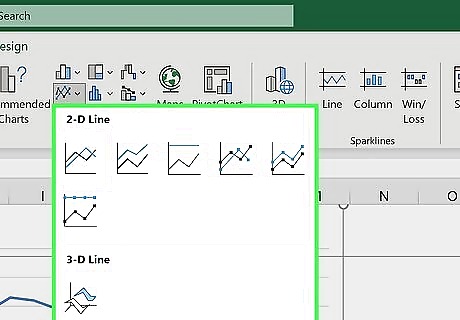
Hover over a line graph style. Hover the mouse cursor over a line graph template in the drop-down menu to see what it will look like with your data. The first section of graphs has traditional two-dimensional line graphs, while the second has one or more 3D line graphs. If you have a lot of data, the preview may take a moment to appear.
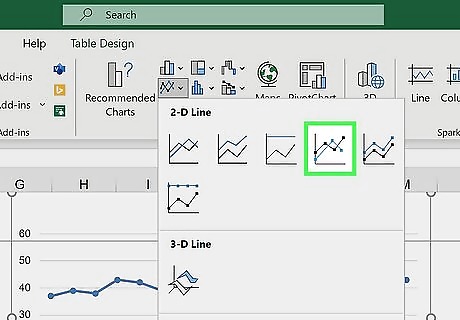
Click a graph style to select it. Once you decide on a line graph template, clicking it will create your graph in the middle of the Excel window.
Customizing the Graph
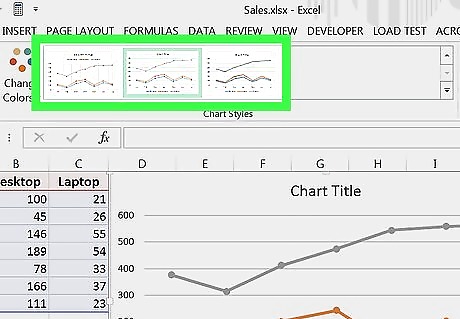
Change your graph's style. Once you create your graph, the Chart Design toolbar will open. You can select one of the styles in the toolbar to quickly select a new look for your line chart. If this toolbar doesn't open, click your line graph and then click the Design tab in the green ribbon.
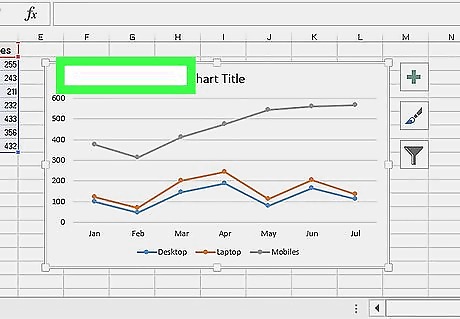
Move your line graph. Click and drag the white space near the top of the line graph to move it. You can also move specific sections of the line graph (e.g., the title) by clicking and dragging them around within the line graph's window.
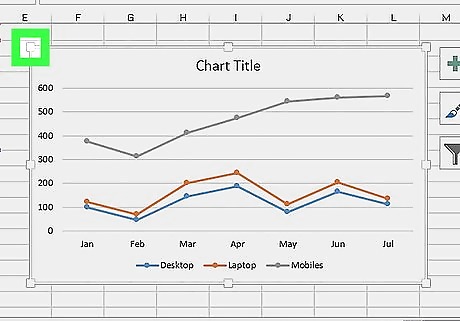
Resize the graph. Click and drag one of the circles on one of the edges or corners of the graph window in or out to shrink or enlarge your graph.
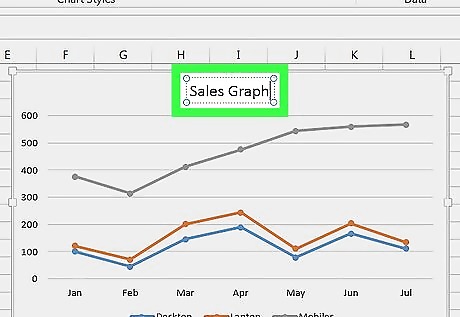
Change the graph's title. Double-click the title of the graph, then select the "Chart Title" text and type in your graph's name. Clicking anywhere off of the graph's name box will save the text. If you want to label your graph's axes, click the graph. Click + at the right side of the graph. A pop-up menu will open. Check the box for Axis Titles. Double-click the Axis Title box and delete the default text. Enter a new title.


Comments
0 comment