142
views
views
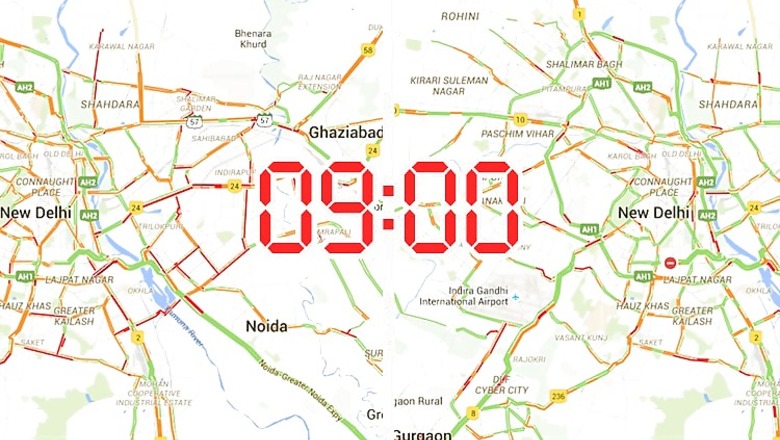
We captured traffic data at hourly intervals from 7:00 AM to 11:00 AM on Tuesday, January 5, 2016.
This new year began on an odd note to help even out Delhi's toxic air. In case you are still wondering what this odd-even formula is all about head here or refer to the infographic below the map to know more.
While the impact of this 15-day experiment on Delhi's hazardous air pollution is being measured, the traffic situation has noticeably improved. Because data and visuals can often tell the story much better than a 1000-word write-up, here's an animated map showing how smoothly vehicles have been moving on Delhi roads today in comparison to the usual traffic.
We captured traffic data at hourly intervals from 7:00 AM to 11:00 AM on Tuesday, January 5, 2016.


Comments
0 comment