

Highlight the data you want to analyze. The data you select will be used to create your scatter chart. A scatter chart is one that uses dots to represent values for two different numeric values (X and Y).
Click the Insert tab. It's at the top of Excel.
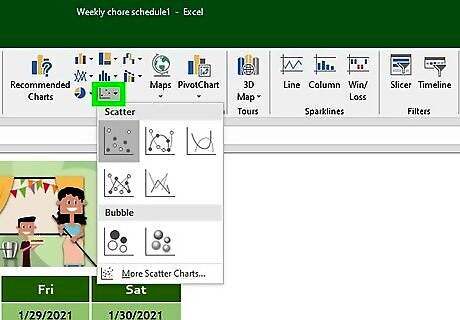
Click the Scatter icon on the Charts panel. It's in the toolbar at the top of the screen. The icon looks like several small blue and yellow squares—when you hover the mouse cursor over this icon, you should see "Insert Scatter (X, Y)" or Bubble Chart (the exact wording varies by version). A list of different chart types will appear.
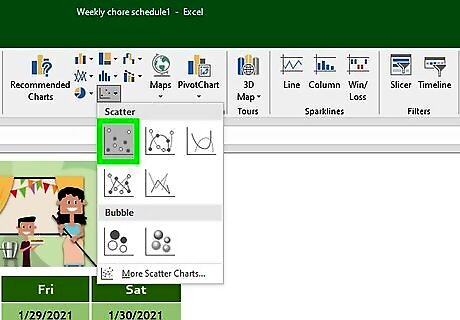
Click the first Scatter chart option. It's the chart icon at the top-left corner of the menu. This creates a chart based on the selected data.
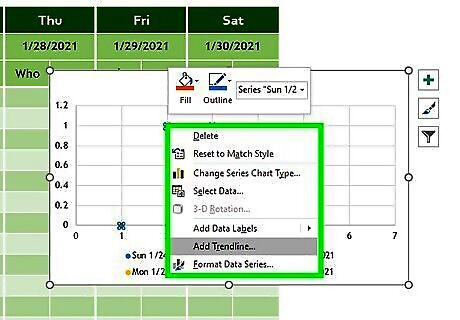
Right-click one of the data points on your chart. This can be any of the blue dots on the chart. This selects all of the data points at once and expands a menu. If you are using a Mac and don't have a right mouse button, hold down the Ctrl button as you click a dot instead.
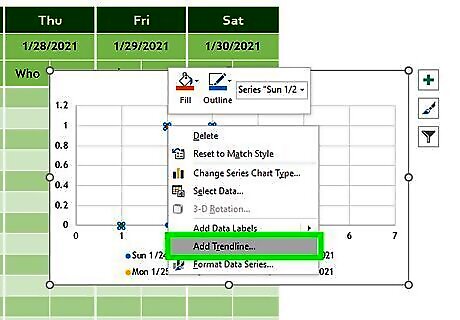
Click Add Trendline on the menu. Now you'll see the Format Trendline panel on the right side of Excel.
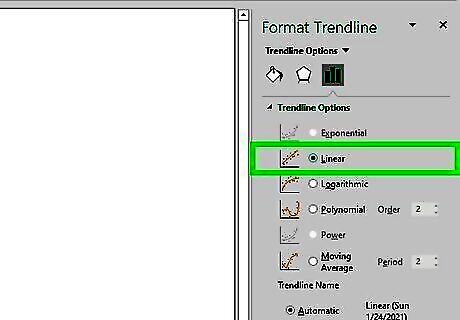
Select Linear from the Trendline Options. It's the second option in the Format Trendline panel. You should now see a linear straight line that reflects the trend of your data.
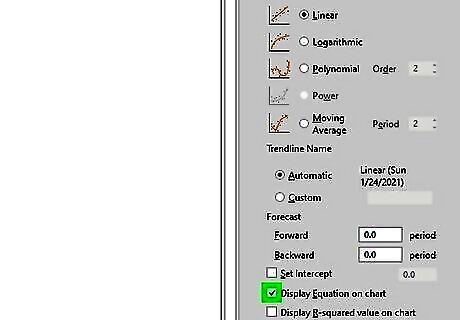
Check the box next to "Display equation on chart." It's toward the bottom of the Format Trendline panel. This displays the math calculations used to create the best fit line. This step is optional, but can be useful for anyone viewing your chart who wants to understand how the best fit line was calculated. Click the X at the top-right corner of the Format Trendline panel to close it.


Comments
0 comment