views
With a surge in Covid-19 infections, Delhi and Chennai were amongst the worst affected cities in India witnessing a similar rate of growth in the first half of June. While the national capital had seen the number of cases rise by 2.37 times in the first 16 days of June, the corresponding multiple for Chennai was 2.3.
To tackle the situation, the cities adopted two distinct methods. Chennai went in for a complete lockdown. Delhi did not but ramped up its testing and health infrastructure.
From 37,070 on June 18, Chennai’s cases went up to 68,254 at the end of the 17-day lockdown on July 5 – a 1.85 times increase. Delhi saw its cases almost doubling from 49,979 to 99,444.
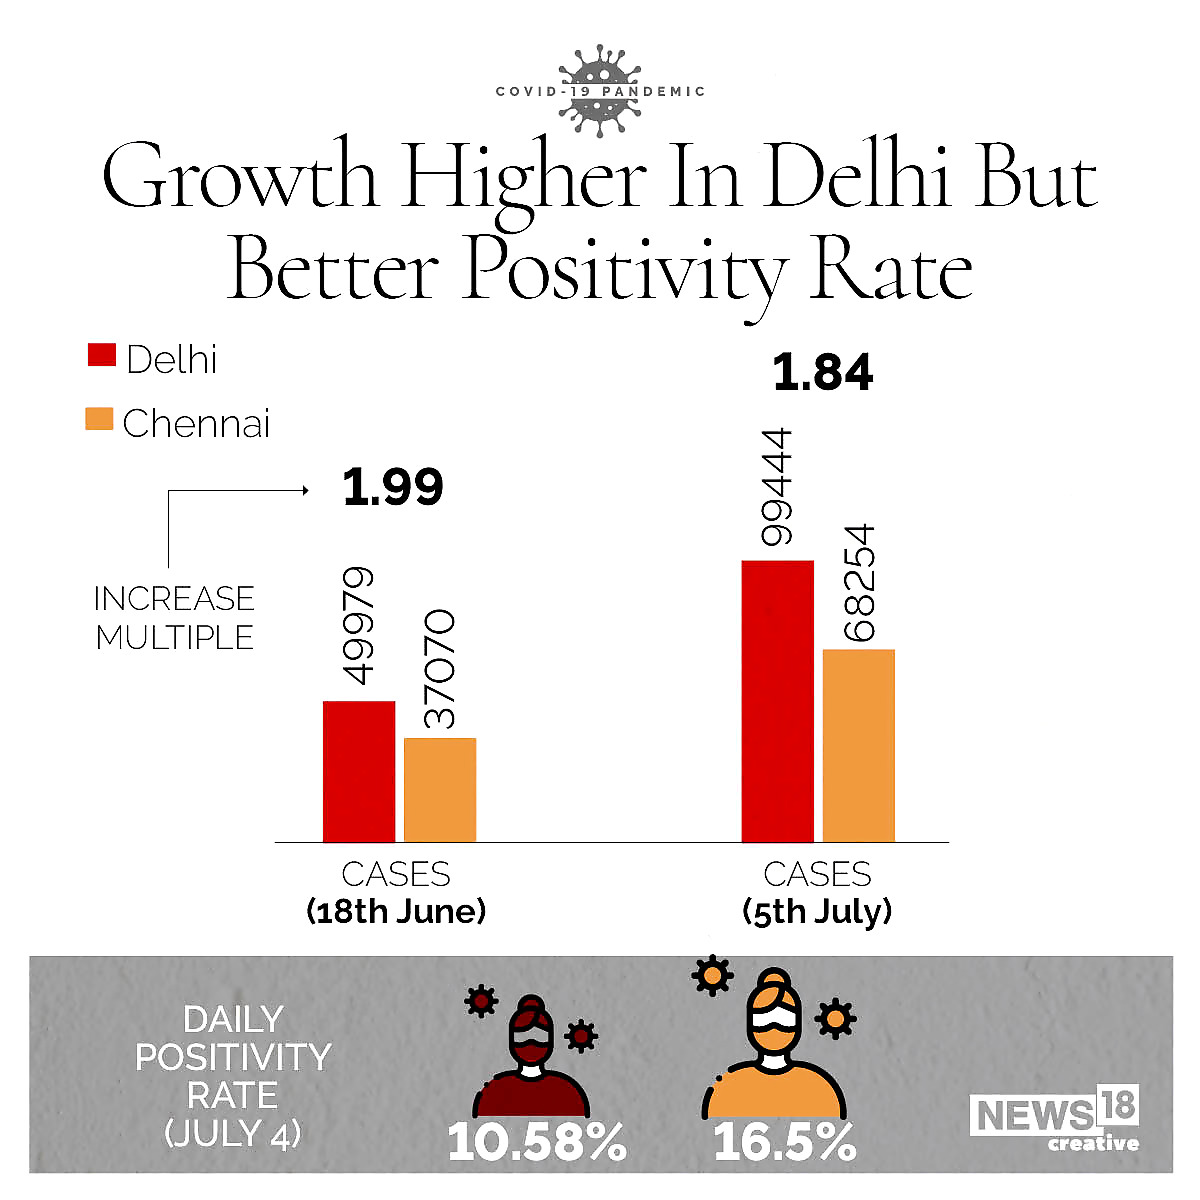
The rise in cases in Delhi was higher than the rise in Chennai in this period. But this was a direct result of the increased testing in the capital. Delhi recorded a Positivity Rate of 15.35% in the time-frame. Its Daily Positivity Rate saw a downward trend – from 24% on June 19 to 19.59% on June 25 to 12.24% on July 1, 11.4% on 2nd, 10.43% on 3rd, 10.58% on 4th and 9.7% on the 5th.
Chennai’s Daily Positivity Rate also came down from an alarming 31.6% on June 15 to 20.62% on July 3 to 16.5% on July 4. The city conducted more than 10,000 tests each on July 3 and 4.
So while both the cities have seen a sharp decrease in their Positivity Rate, Delhi has done comparatively better with one in 10 testing positive according to the latest numbers as compared to one in six in Chennai.
A glaring difference, however, has been in the number of recoveries. While Chennai’s Recovery Rate went up from 53.1% on June 18 to 61.99% on July 5, Delhi, courtesy its enhanced testing, increased capacity of beds and scaled up health infrastructure, saw a dramatic increase in recoveries during this period with the percentage rising from 42.7% to as high as 71.74%! The national Recovery Rate stands at 60.86%.
Another telling statistic has been the growth rate of fatalities. While there has been a 1.56 times increase in the rate of growth of deaths in Delhi without a lockdown, the increment has been higher in Chennai at 2.11%, with a lockdown!
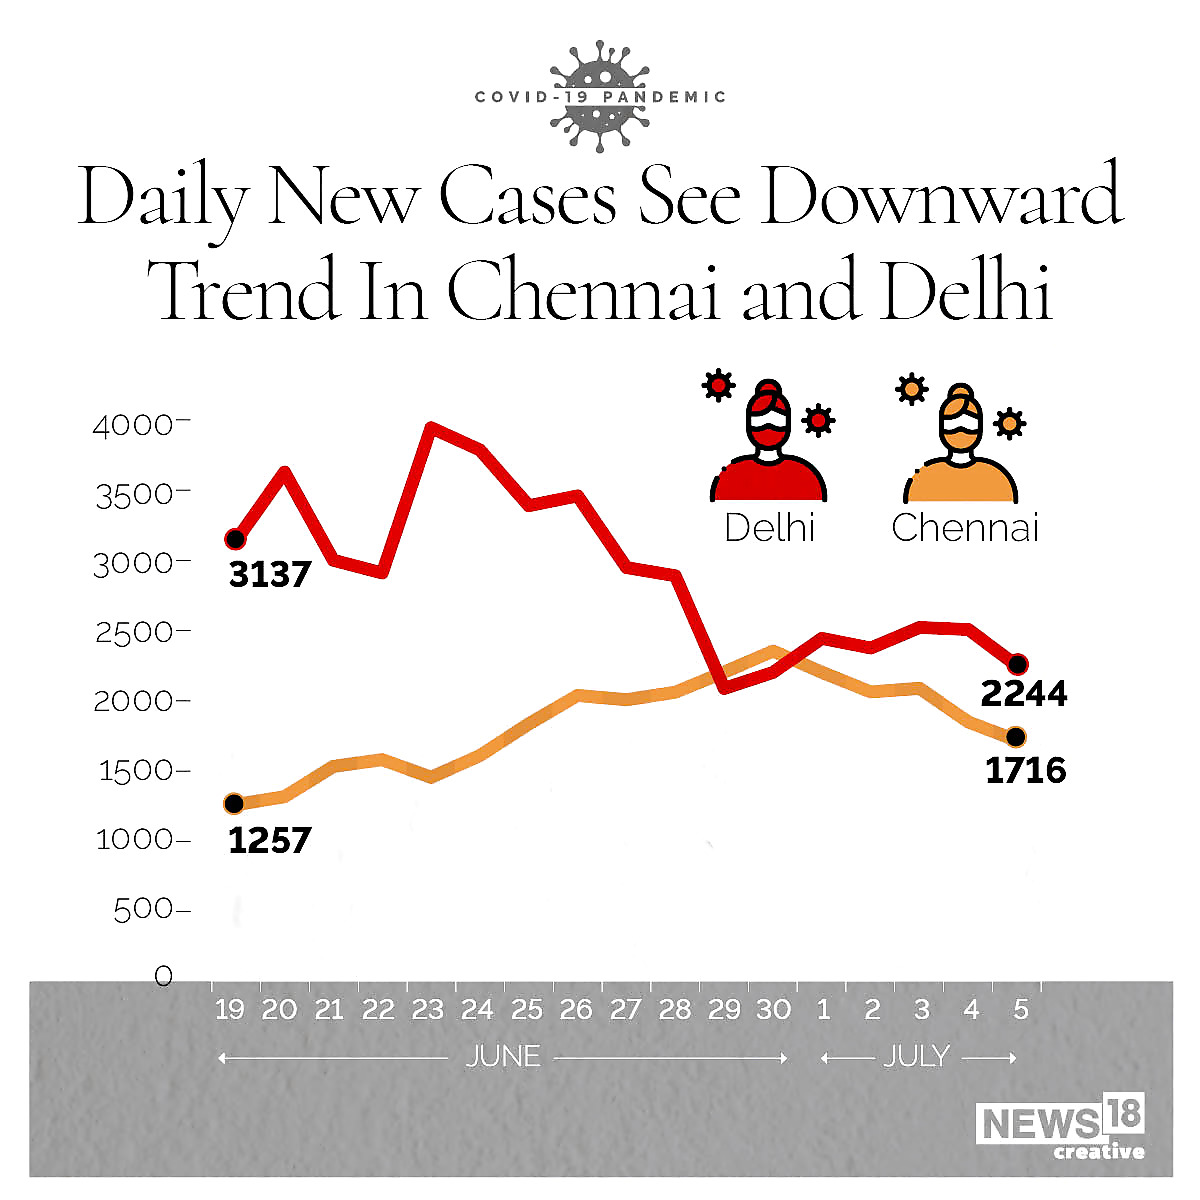
Delhi reached a high of 3,947 cases on June 23 post which it has witnessed a downward trend in daily new cases. Chennai saw a rise till June 30 (one of the two days in this period where it recorded a higher daily count than Delhi) but has seen a dip thereafter.
Overall, between June 19 and July 5, Delhi recorded a total of 49,465 cases whereas the corresponding number in Chennai was 31,184. The number of deceased in Delhi was almost double of Chennai in this period.
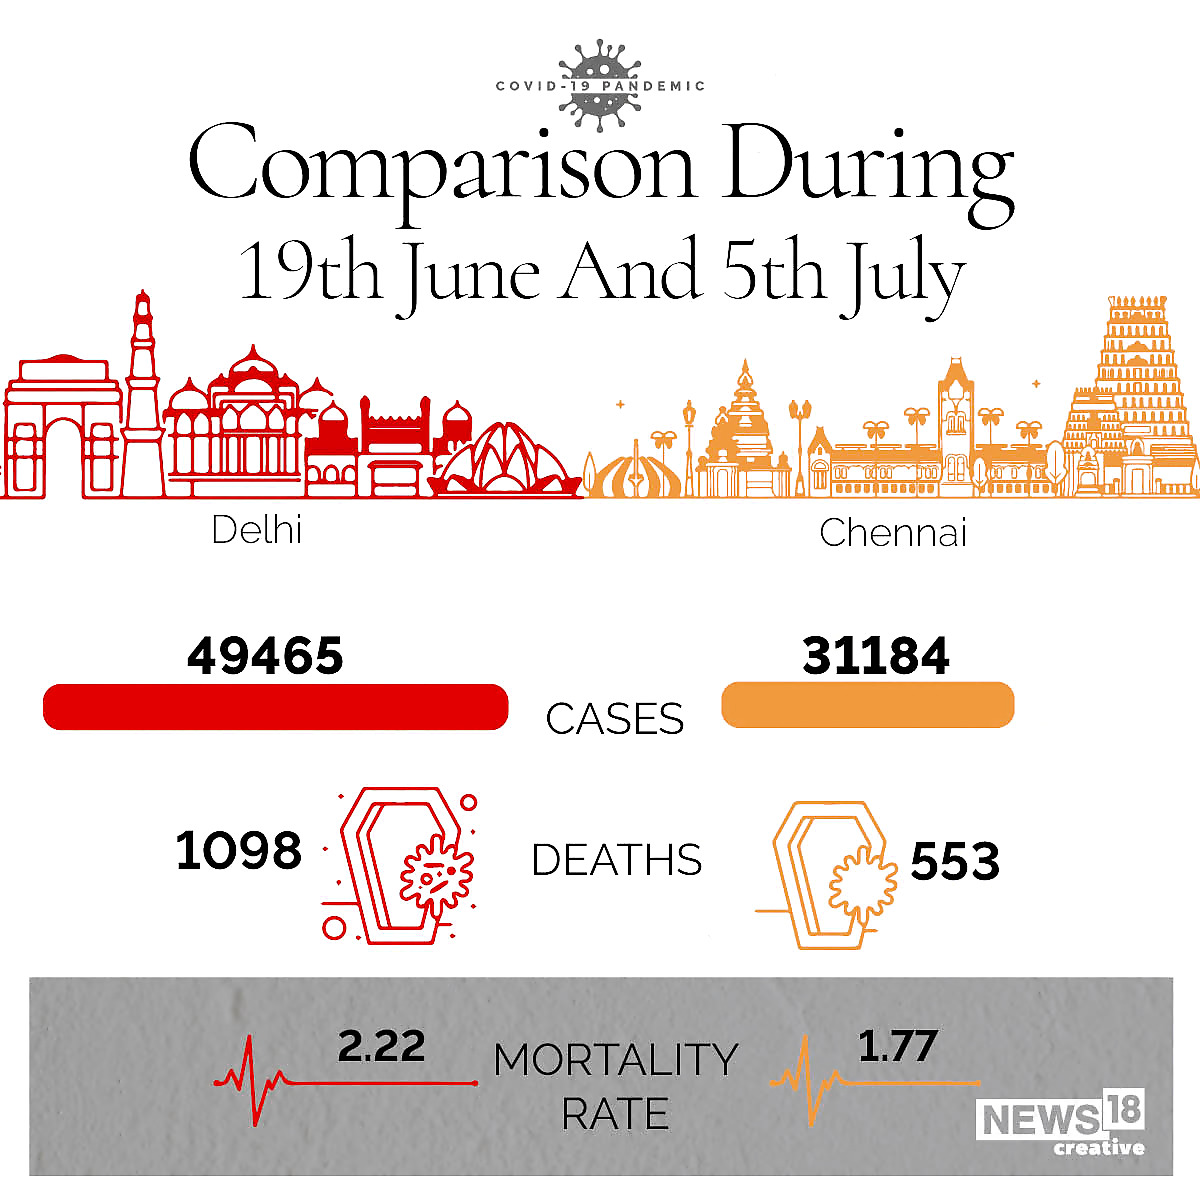
While Delhi has a higher Mortality Rate than Chennai during this 17-day period, its percentage has drastically come down from 3.94% till the June 18 to 2.22% during this period. In contrast, Chennai’s Mortality Rate, although still low, has gone up a few notches from 1.34% to 1.77% during the lockdown.
A curious statistic has been the stability in the number of deceased in Delhi. Out of the 17 days in this period, 12 days have seen a daily count in the 60s, 4 in the 50s and a high of 77. Chennai has a bigger range with fluctuations from a low of 21 to a high of 46.
While the 17-day lockdown has helped Chennai bring the number of daily new cases on a downward slope and brought down the Positivity Rate, there has been an increase in the rate of growth of deaths.
Delhi, while not adopting a lockdown went for a massive ramp up in testing and increase in Covid-19 beds – this has not only got the number of new cases to come down but also substantially reduced the Positivity Rate. Even more significantly, it has seen a drop in the rate of growth of deaths and the Mortality Rate.
Which approach has worked better? Well, the numbers tell the story.





Comments
0 comment